The Business Process Model consists of activity diagrams depicting the events that impact the process, the actors responsible for executing the activities of the Business Process, and the activities themselves. It may also include objects that are created by activites and passed to others. The following diagram shows the top level Business Process model for the (EA)<sup>2</sup> reference model.
On the diagram, you can see the Business Events that either initiate, impact (cause the process to change), or end the process. For example, the Season Setup Date event causes the Membership Policy DefinitionProcess and Sports Program Development Policy Definition Process to begin, effectively defining how the Sports Club will be run. The League Registration Open Date event causes the Membership Registration Process to begin. The League Setup Date impacts the Membership Registration Process, causing it to start charging late fees during registration. The League Registration Final Close Date cuts off registrations. The Member Registration Process requires the Member Eligibility Policies that were previously created in the Membership Policy DefinitionProcess.
At this top level, most of the activities are independent off each other except that they may require something that a previously run activity produces. This dependency is represented by the object flows between the object nodes (the square boxes on the activities). There is one control flow shown. It is the one with the [Changes to League Components] constraint and shows that changes may occur during the Season Execution Process, like new players moving into the area and joining the club.
Drill Down Capabilities
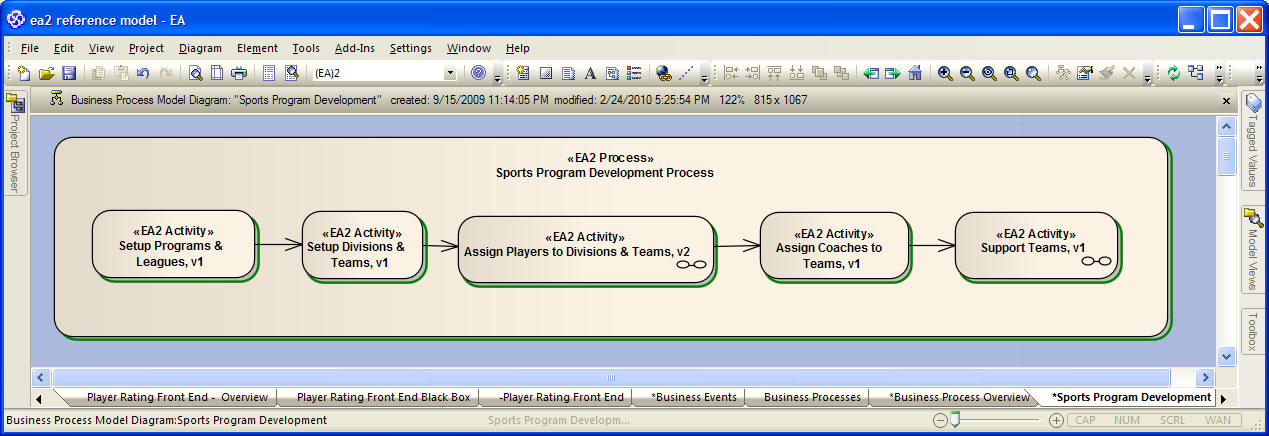
Business Process are decomposed into lower level activities. Elements that have the infinity-like sign on them are composite objects. You can drill down into them by double clicking on them. Each drill-down will take you to more and more detailed activities until you reach the atomic level represented by Business Functions. For example, drilling down into the Sports Program Development Process reveals the following diagram.
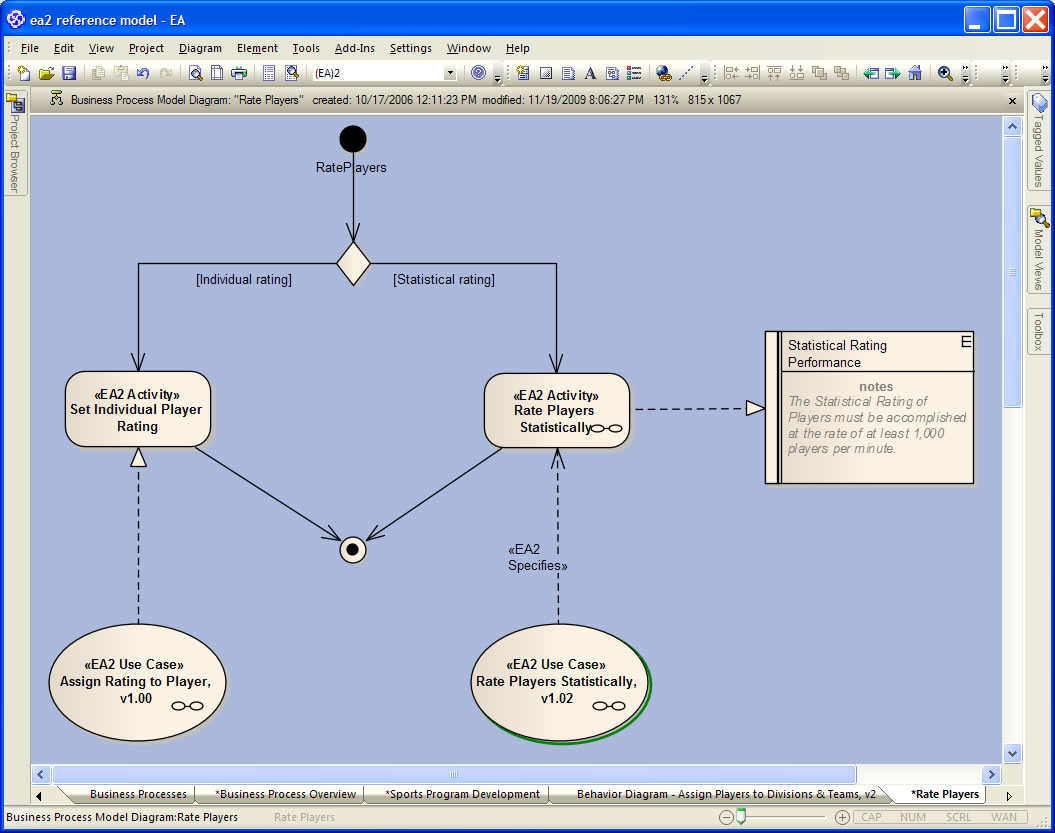
As we continue to drill down, we come to a diagram that shows a Quality Attribute.
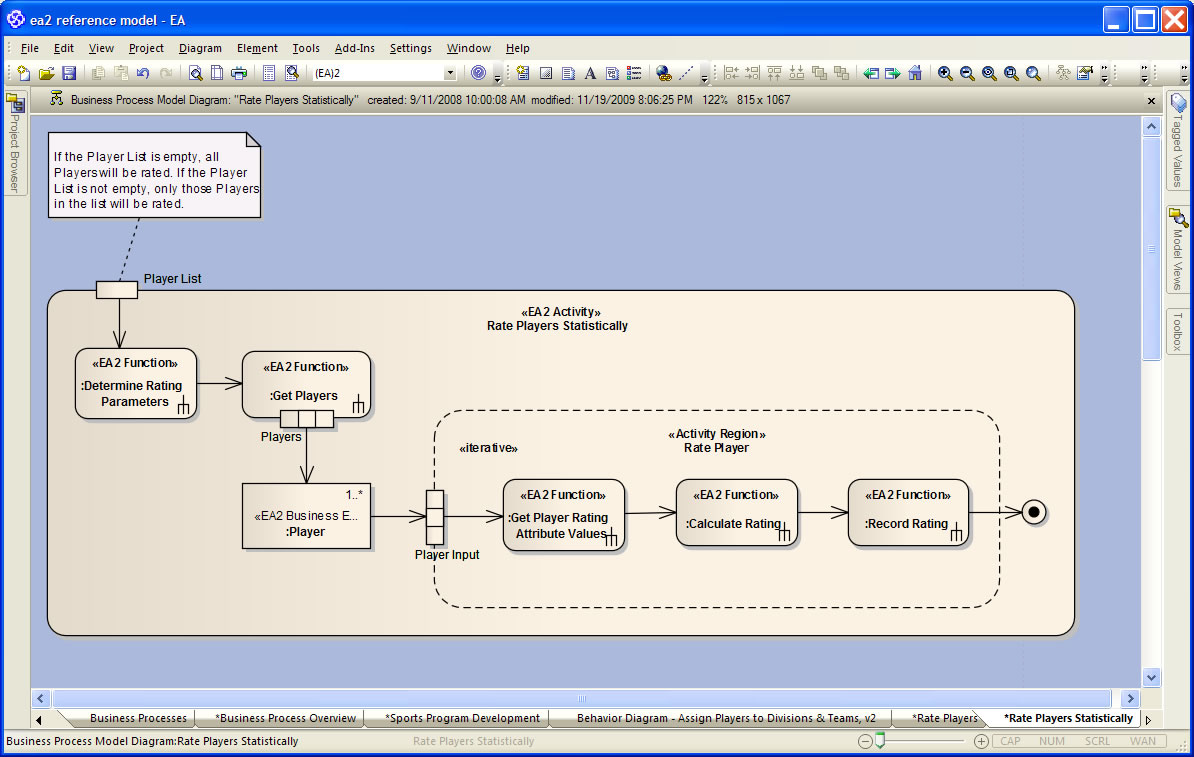
Here we see that the Rate Players Statiscally activity must be accomplished at the rate of at least 1,000 players per minute. The next drill down takes to the bottom level.
Here we have reached the Business Function level, which is an atomic activity conducted by a single actor. These may be re-usable and, therefore, are kept under the Business Architecture area of the model.